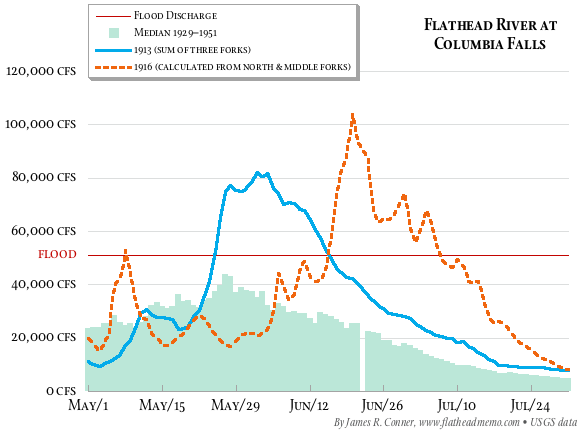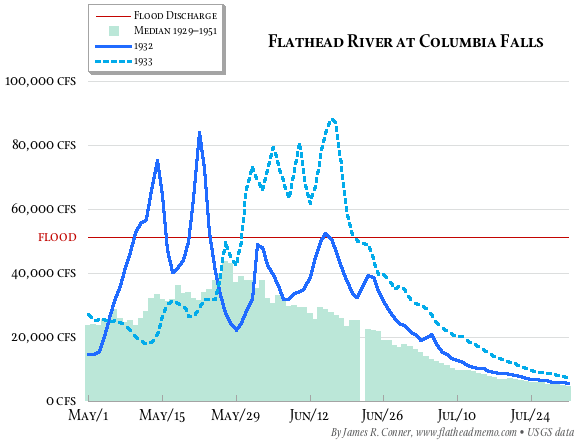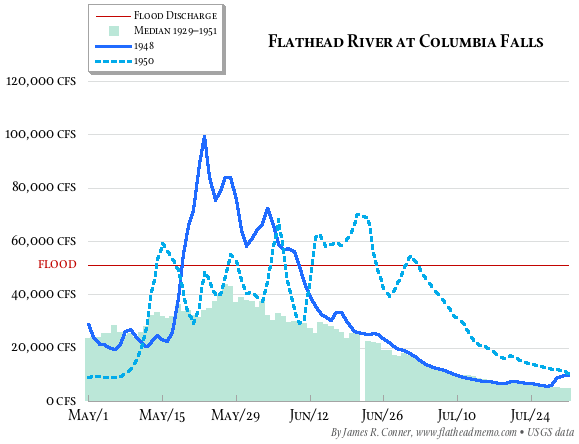
Major floods occurred in 1894, 1916, 1927, 1928, 1933, 1948, 1964, and 1975. The USGS inferred discharge and stage for 1894, evidently measured the peak value in 1928, and extrapolated the rating curve for the mainstem river at Columbia Falls upward in 1964, and upward at West Glacier for the Middle Fork in 1975. The magnitude of the 1927 flood can be inferred from the river’s discharge at Polson. In 1916, the North and Middle Forks were gaged. I derived a regression equation from data from the 1930’s. When I applied it to the values for 1916, it was obvious that the Flathead’s peak discharge at Columbia Falls reached at least 100,000 cfs, making it comparable to the floods of 1928 and 1948.
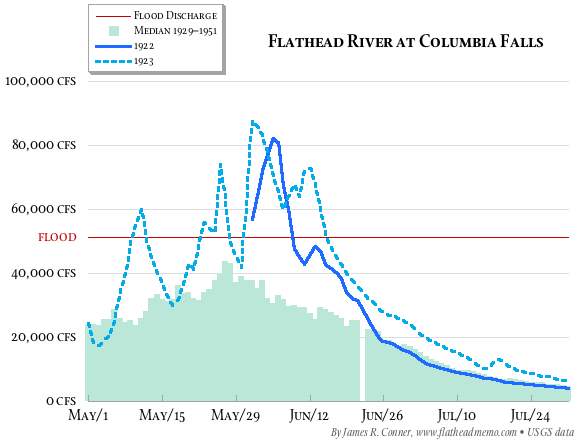
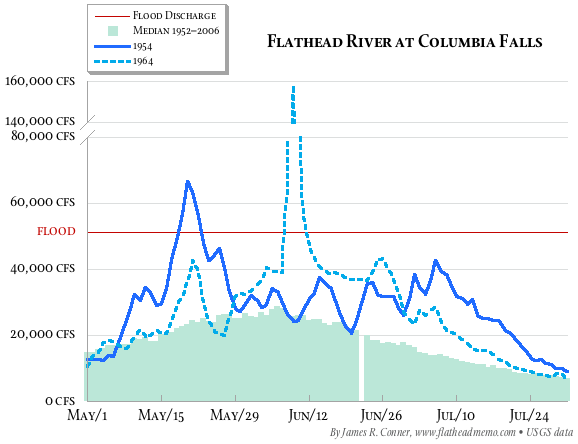
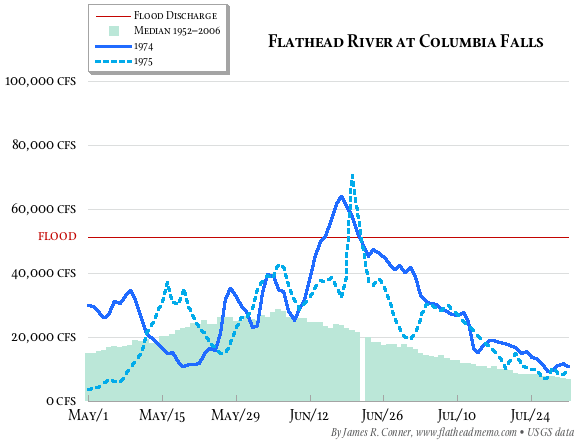
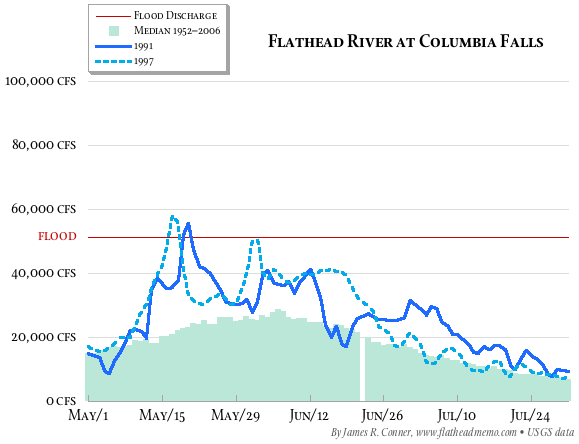
All the hydrographs below display mean daily streamflow. Peak streamflow tends to average five percent higher.
There are no hydrographs for 1894, 1927, and 1928. And I’ve added several hydrographs of floods that were not major to provide some perspective.
The USGS webpage for the gaging station at Columbia Falls has much useful data. The Northwest River Forecast Center publishes a station rating table for the Flathead at Columbia Falls. I would exercise some caution in using the table’ values to derive a stage value for 1916. The river has changed a bit in the last 96 years.
Update 8 April 2014. In the graphs below, the flood stage red line is for the discharge at 14 feet. Last year, the flood stage was lowered to 13 feet, for which the discharge is approximately 45,000 cfs. I’ll update the graphs when I get time, but for now use you eyeball to adjust the flood line.