If you look at the USGS gaging stations for the North and Middle forks of the Flathead River, you’ll see these rivers are still running well above the historical median (and mean) for middle to late summer. Just how much above the historical norms becomes apparent, however, only after a closer look at the statistics.
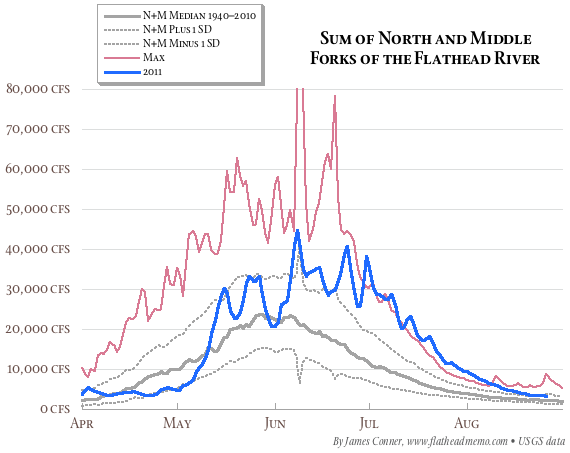
The sum of the discharges of the North (above Columbia Falls) and Middle (at West Glacier, below the outlet of McDonald Creek) Forks provides the best single number for evaluating the runoff for the Flathead River above Flathead Lake. The discharge of the mainstem river at Columbia Falls is skewed by the outflow from the South Fork, which is regulated by Hungry Horse Dam, but the North and Middle Forks are not regulated; their streamflow is natural and thus tells us a great deal about each year’s snowmelt, runoff, and total streamflow.
In most years, the sum of the forks peaks in late May to early June, and the hydrograph is a pretty good approximation of a classic bell curve (Graph 1). Because 2011’s spring was wet and cold, the North-plus-Middle discharge was well below normal during April and early-May. By mid-May, the discharge reached, then exceeded, the median for 1940–2010, and by June stayed at or well above the median for the rest of spring through 26 August.
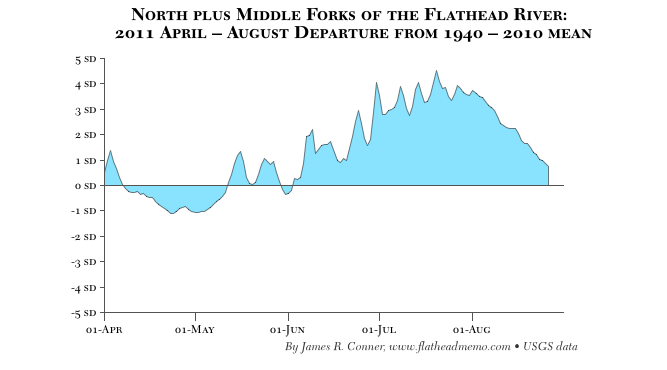
Just how much above the norms becomes apparent when you examine Graph 2, a time series graph in which the N+M daily discharge is plotted as the number of standard deviations from the 1940–2010 mean. The values for late July and early August are so high that I’ve asked some experts to review my data (Excel) and calculations. So please treat this analysis as preliminary and subject to change.