Updated with 2012 primary statistics. Montana's primary turnout for 2012 was comparable to the turnout for the 2004 primary. I've updated the graphs below accordingly. The PDFs of the graphs, incidentally, can be viewed at 200 percent with excellent resolution.
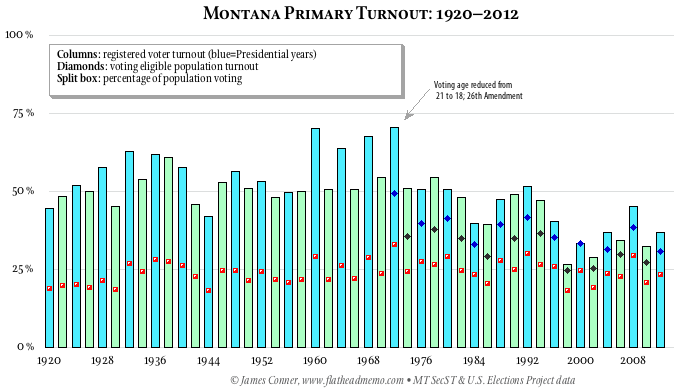
If turnout is the measure of how seriously voters take an election, Montana’s voters are taking primary elections less and less seriously. Whether turnout is measured by the percentage of registered voters casting ballots, or by the percentage of the voting eligible population (voting age residents minus ineligible persons such as foreign nationals and imprisoned felons) casting ballots, the trend line is down, as shown in Graph 1 below.
This is worrisome. Low turnout weakens government, the legitimacy of which derives from the consent of the governed. Although it can be argued that not voting is tacit consent, even approval, it can be argued with at least equal effect that not voting is a deliberate act of disaffection. Moreover, an affirmative expression of consent provides a much greater measure of legitimacy than does silence.
Although I plotted the percentage of population voting statistic (white-red split boxes), this statistic is difficult to interpret. Reducing the voting age increases the VEP. So does an aging population. Other factors affecting the size of the VEP and registered voters cohorts are residency requirements, and for registered voters, registration rolls purge rules. Because purge rules, and the efficiency of the purges, skew registration numbers, the best statistic for computing turnout is the voter eligible population. Montana’s secretary of state does not provide VEP data, although it’s available.
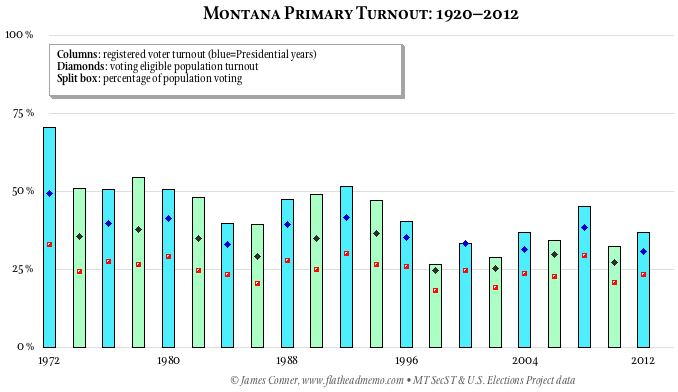
Graph 2 displays the turnout from 1972, the first election after the 26th Amendment lowered the voting age from 21 to 18, and is a bit easier to read than Graph 1. The falloff in off-year elections usually is attributed to an especially low turnout in the age 18–29 cohort, but that effect does not explain the overall decline in primary voting.
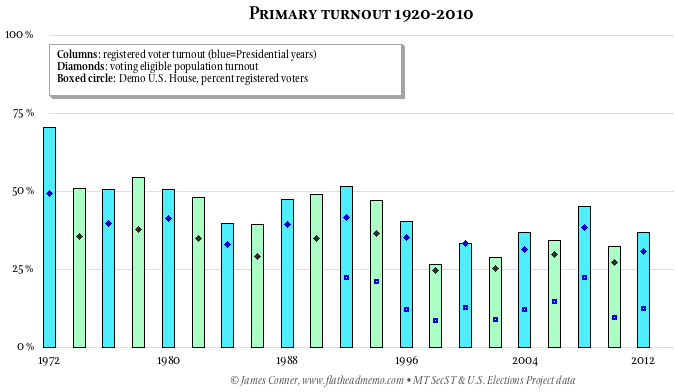
Graph 3 adds turnout in the Democratic primary for U.S. House. After the 1990 census, Montana lost one of its two Congressional seats. The western district incumbent, Democrat Pat Williams, defeated the eastern district incumbent, Republican Ron Marlenee, winning a majority of the vote. Williams won again in 1994, his last hurrah, with a plurality thanks to Steve Kelly’s independent candidacy. After that, Republicans won the next eight elections. Except for 2000, when Nancy Keenan came close to defeating Denny Rehberg, Democratic candidates have not been competitive.
See also: Reversal of fortune for Montana’s Democrats began in 1988 and Daine’s dollars dwarf Dem’s dollars.
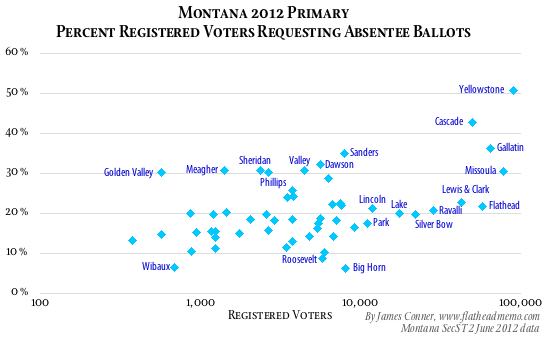
We’ve now suffered a decade of wide open, no excuses, absentee voting in Montana — and we really don’t know whether it has an effect on turnout, let alone know whether the effect is depressing turnout or keeping it from being more depressed than it is. Graph 4 displays the percent of registered voters requesting absentee ballots as a percent of the number of registered voters in each county. I’ve labeled some of the counties, and provided an Excel spreadsheet with the numbers as of 2 June 2012. Up to the minute absentee and voter registration statistics are available on the Montana Secretary of State’s website.
See also: Mail ballot folly, a series of special reports on turnout, mail ballots, early voting, and absentee voting.