On the eve of the 2012 presidential election, Montana has more registered voters than ever — but the percentage of the voting eligible population that is registered is slightly more than two percent below number for 2008. That’s because Montana’s population, now at approximately one million, has grown and the registration of newly eligible voters has not been as efficient as in 2008.
The voting eligible population is the voting age population (18 years of age and older) minus foreign nationals, felons behind bars, and other not eligible to vote. In Montana, VEP tends to average 98.8 percent of the VAP. In other states, of course, the ratio varies.
Below, three graphs.
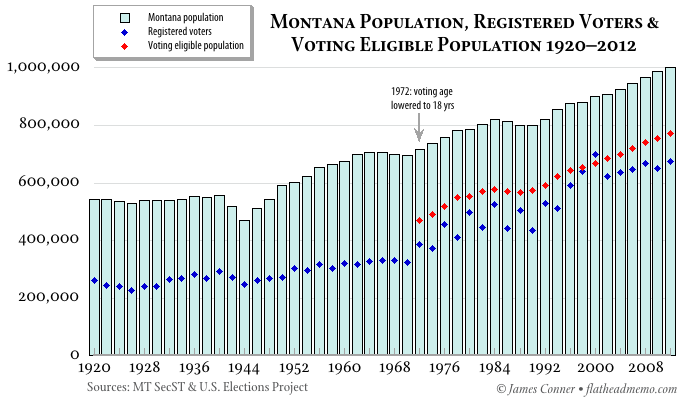
The first displays Montana’s population, voting eligible population, and registered voters for 1920–2012. The voting age was lowered to 18 in 1972, and the VEP data begin in 1972 (I’m working on estimates for earlier years, but the data are not easily found and early census records are not as reliable as they are now). In 2000, registered voters exceeded the VEP because the registration rolls had not been properly purged. That’s a good reason to use VEP for measuring turnout and developing elections policy.
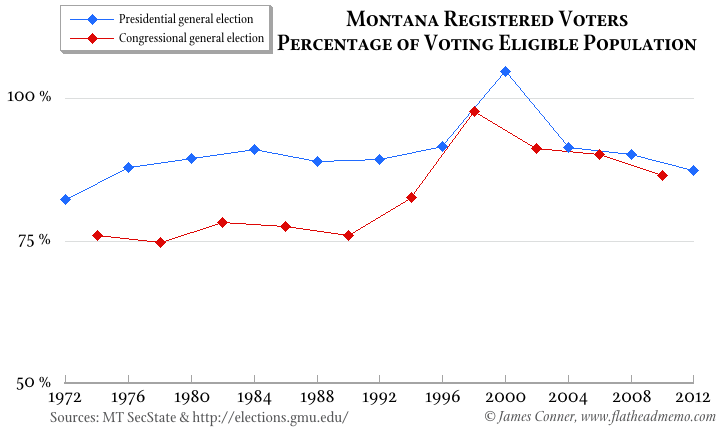
Next, a graph displaying registered voters as a percentage of the VEP for 1972–2012. Note that the percentage for 2008 is higher than for 2012.
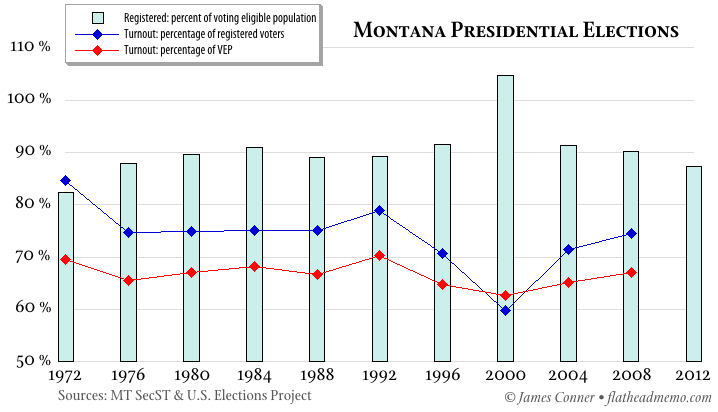
Finally, turnout for presidential elections both as a percentage of registered voters and the VEP. The columns display registered voters as a percent of VEP.