Serving the Flathead Valley & Montana since 2006. A reality based independent journal of observation & analysis. © James Conner.

See update below. The number of registered voters changes slowly from day-to-day except during voter registration drives. In Montana from 24 March to 4 April 2014, 33 counties grew their voter registration roll by less than one percent; 4 counties stayed the same; and 17 counties experienced a less than one percent decline in the number of registered voters (Excel spreadsheet).
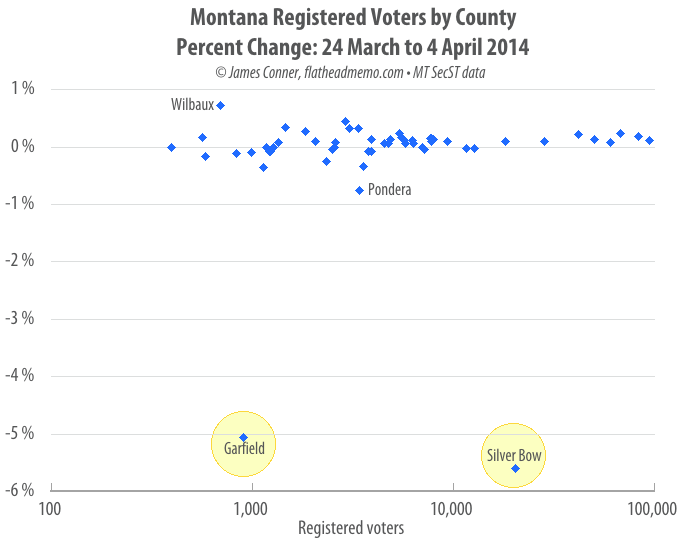
But in two counties — Garfield and Silver Bow — the decline in registered voters was much greater: 5.1 percent for Garfield, and 5.6 percent for Silver Bow. Garfield has less than 1,000 registered voters, so its roll declined by just 46 voters. But Silver Bow went from 20,334 to 19,196 registered voters, a decline of 1,138.
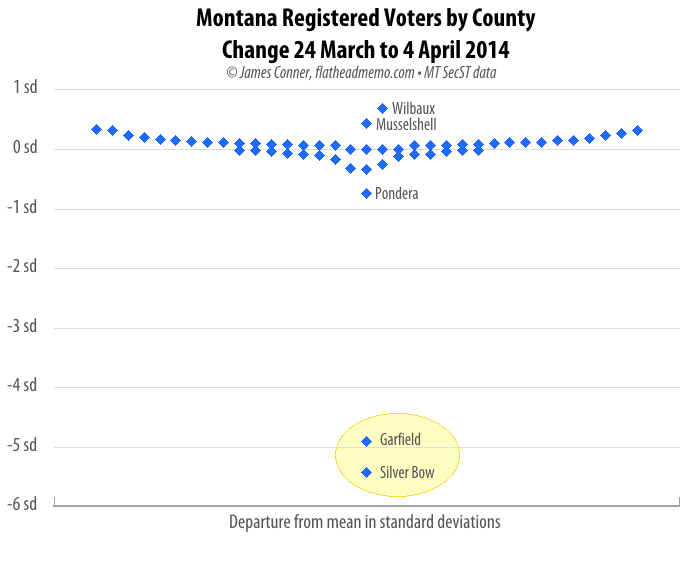
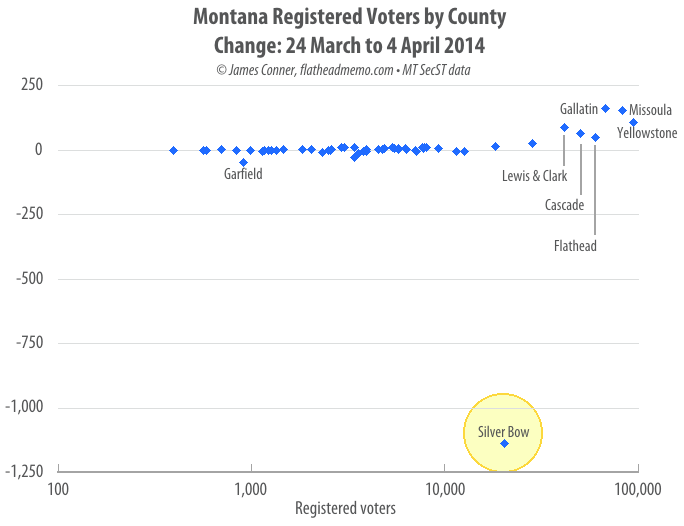
That’s a statistically eye-popping five plus standard deviations — and a big red flag that I’ll discuss in a moment. But first, some charts:
Above, Silver Bow is clearly an outlier, but Garfield appears within the normal range. Plotting the difference as a percent (below) identifies both Garfield and Silver Bow as outliers.
My data come from the Montana Secretary of State’s website, which posts daily a downloadable spreadsheet of the current tally of registered voters by county. I don’t know whether historical daily data are available, so after filing for office closes, I download the voter registration spreadsheet every week and add the values to both a master spreadsheet and database. I started on 24 March, could not find a current spreadsheet on 28 March, and yesterday downloaded the 4 April spreadsheet.
Because I’m interested in voter registration changes over time, I subtract the last numbers from the current numbers, convert the results to percentages, and calculate standard statistics such as mean, RMS, and standard deviation.
My manipulations of the data also serve as quality control tests. Sometimes numbers are wrong because someone blundered.
At this point I don’t know whether there was a huge decline in Silver Bow’s number of registered voters. There’s a huge change in the numbers reported by the Secretary of State, but those numbers may not be correct. So the first step is letting both parties know what I found so that they can review their records. If I were a betting man, I’d put my money on human error.
But if registration really did decline by that much in Silver Bow County, an explanation is in order.
And today, 7 March 2014, the explanation arrived thanks to Silver Bow’s clerk and recorder, Sally Hollis, who responded to my inquiry with commendable celerity. The number of registered voters did decline by 1,138. Here’s why: