A reality based independent journal of observation & analysis, serving the Flathead Valley & Montana since 2006. © James Conner.
After posting How dry it is a few days ago, in which I compared the combined flows of the Flathead River’s north and middle forks for 2015 and 2001 to the 1940–2014 median for the combined flows, my old friend, and cartographer extraordinaire, Ed Madej, asked a very good question:
Very interesting… Why did you go back to the 1940s to show the median line? NWS and Weather Underground are using the last 30 years, which WU refers to as the globally warmed years as “average” weather.
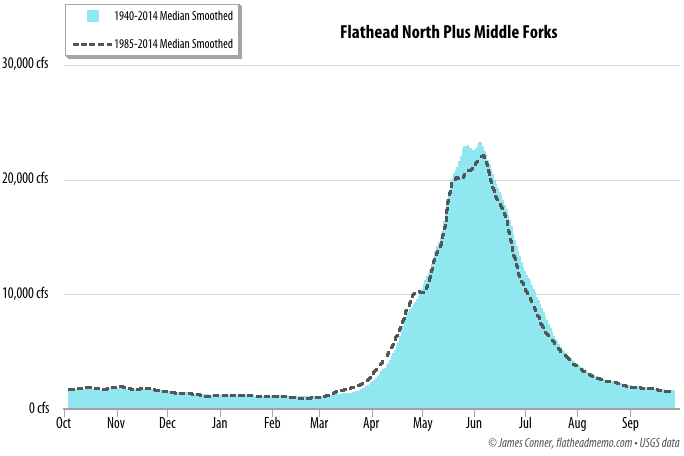
My initial answer was that I believed the NWS’s forecasting models were limited to 30 years of data, but I decided to compare the N+M 1940–2014 median with the 1985–2014 median — and produced this graph:

Fascinating — and wrong!
How I got it wrong still baffles me, but wrong it is; and not just slightly wrong, but big league blunder wrong.
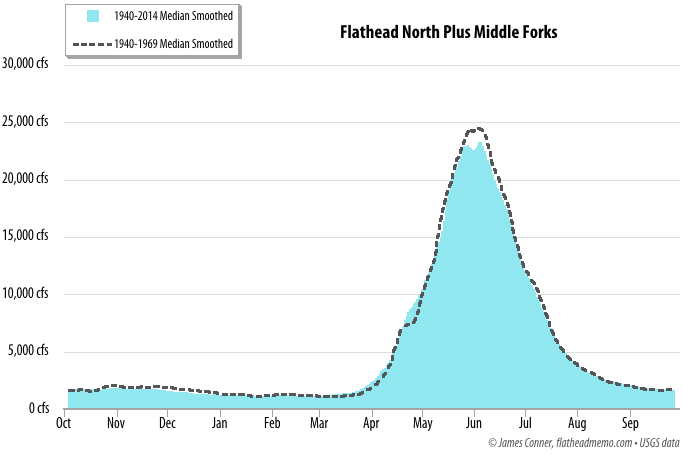
Here’s the actual 1985–2014 median plotted against the 1940–2014 median:
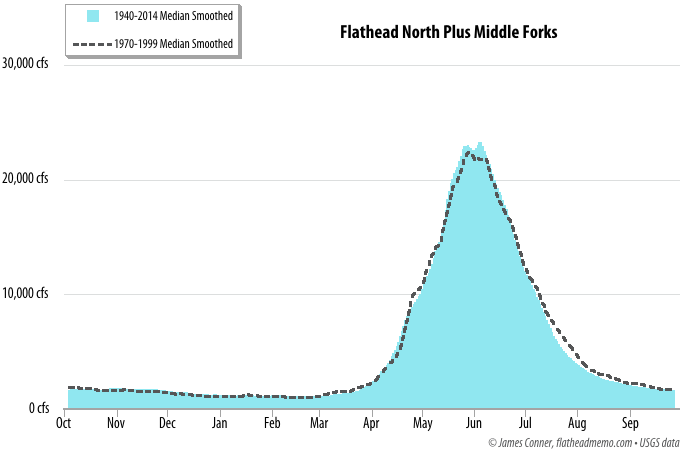
The median for the most recent 30-year period is pretty much the same as the median for the 75-year period beginning in 1940. But what about previous 30-year medians? A fair question. So I plotted five 30-year medians, beginning with 1940–1969, against the 1940–2014 median:
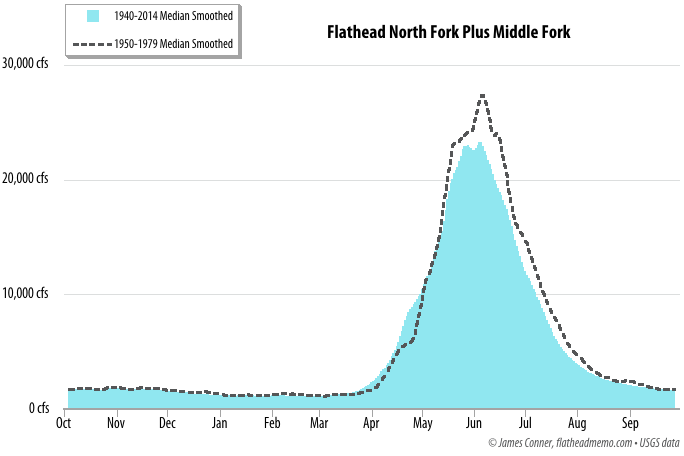
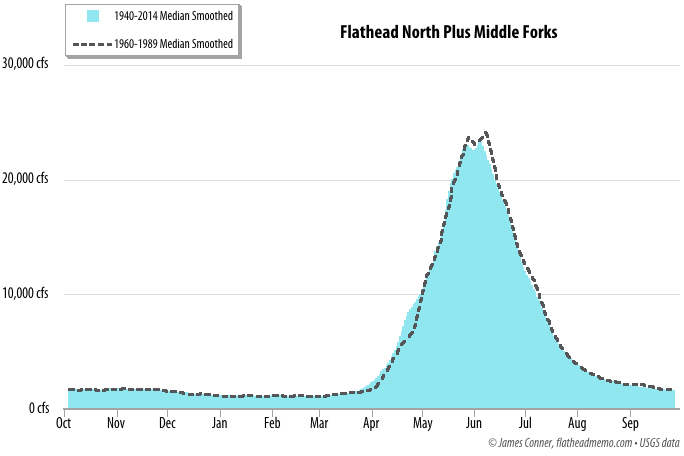

I also tested the medians against each other using two statistical tests, Student-t, and Wilcoxan. No statistically significant difference at even the .75 level. If global warming is affecting the combined flows of the north and middle forks, it’s not showing up in the median. It might be appearing in the date of the peak combined flow, but that’s a question for another post.
My conclusion: the 1940–2014 median remains a valid for the N+M statistic, and should be the median against which a given year’s hydrograph is compared.
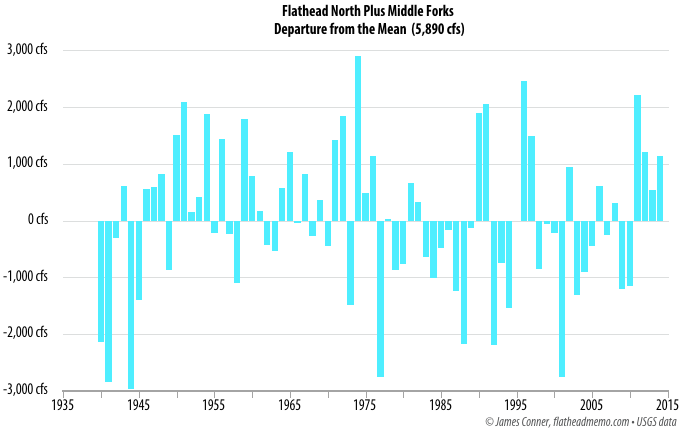
And those hydrographs vary. A lot. Here’s a column chart of the N+M’s annual departures from the 1940–2014 mean:
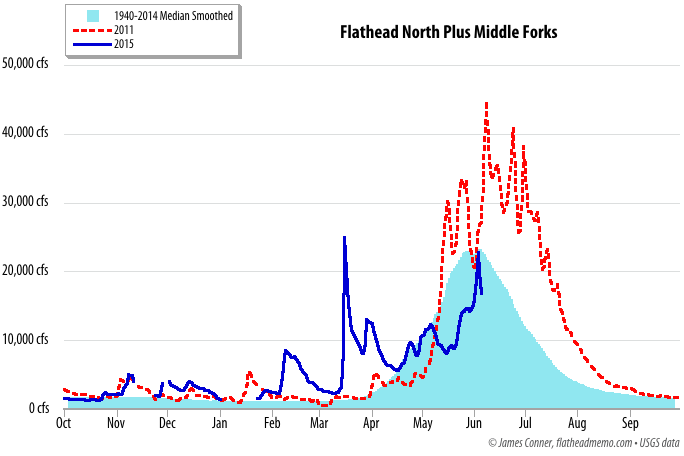
And here’s how 2015 and 2011 compare to the 75-year median:
A note on the record. The USGS began measuring the stage and discharge of the Flathead’s three forks in 1910, but there are gaps in the record. The south fork has been gauged continuously since October, 1928, but the north and middle forks were not gauged continuously until the late 1930s.
The present middle fork gauge, established in 1939, is downstream from the confluence with MacDonald Creek. The gauge previous to it was located upstream of MacDonald Creek, near the old bridge across the river at West Glacier.
In theory, there are several ways to adjust the old middle fork values to the values from the current gauge, but in practice, there’s a lot of variation because some of the records aren’t that good. Although both stations were operated for a few years during the 1940s, I’ve found instances where the numbers indicated the water was running uphill. By subtracting the south fork from the mainstem at Columbia Falls for 1940–1950, and applying a correction, I managed to get the RMS of the predicted N+M down to 7.7 percent. That’s probably acceptable for calculating N+M for 1929–1939, especially as most of the scatter occurred during the low-flow months, but I decided to stick with the data from the water years (Oct – Sep) 1940 to the present.