
A reality based independent journal of observation & analysis, serving the Flathead Valley & Montana since 2006. © James Conner.
Today’s Washington Post reports that the latest Des Moines Register poll found Hillary Clinton leading Bernie Sanders by three points. Because the poll’s margin of error is four points, the Post says:
Hillary Clinton and Bernie Sanders are locked in a statistical tie in the hard-fought and unexpectedly close Iowa Democratic presidential contest, a new Des Moines Register-Bloomberg poll found Saturday.
The respected survey found Clinton commands 45 percent of Democratic support and Sanders 42 percent. The poll of 602 likely Democratic caucus-goers has a margin of error of 4 percentage points, meaning Clinton’s lead is within the margin of error. The survey comes three days before the first presidential voting of 2016 and reflects a late surge by Sanders, an independent senator from Vermont who was once considered a long shot here.
A true statistical tie would be 45–45 or 42–42. Hillary’s three-point lead translates into a 77 percent likelihood that she’s actually leading; a lead is not a tie.
Mother Jone blogger Kevin Drum, then blogging at the Washington Monthly, explained the statistical tie fallacy in 2008:
I originally wrote about this back in 2004, but here it is again. The idea of a “statistical tie” is based on the theory that (a) statistical results are credible only if they are at least 95% certain to be accurate, and (b) any lead less than the MOE is less than 95% certain.
There are two problems with this: first, 95% is not some kind of magic cutoff point, and second, the idea that the MOE represents 95% certainty is wrong anyway. A poll’s MOE does represent a 95% confidence interval for each individual’s percentage, but it doesn’t represent a 95% confidence for the difference between the two, and that’s what we’re really interested in.
In fact, what we’re really interested in is the probability that the difference is greater than zero — in other words, that one candidate is genuinely ahead of the other. But this probability isn’t a cutoff, it’s a continuum: the bigger the lead, the more likely that someone is ahead and that the result isn’t just a polling fluke. So instead of lazily reporting any result within the MOE as a “tie,” which is statistically wrong anyway, it would be more informative to just go ahead and tell us how probable it is that a candidate is really ahead. Here’s a table that gives you the answer to within a point or two:
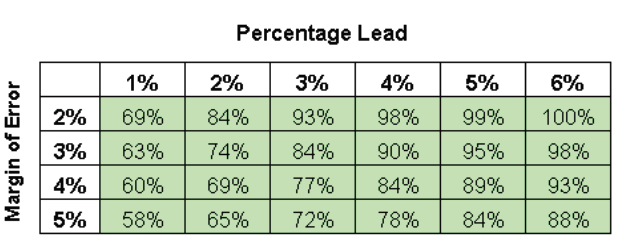
So in the poll quoted above, how probable is it that Obama is really ahead? Pew contacted 2414 registered voters, which means the MOE of the poll is about 2%, and they report that Obama’s lead is 3 percentage points. So go to the top row and then read the number from the 3% column. Answer: there’s a 93% probability that Obama is genuinely ahead of McCain (i.e., that his lead in the poll isn’t just due to sampling error).
The American Research Group has an online Ballot Lead Calculator for determining the probability that Smith leads Jones. It yields the same results as Drum’s table.
Here’s how I think the Post should have reported the results of the Register’s poll:
The new Des Moines Register-Bloomberg poll reports Hillary Clinton is leading Bernie Sanders 45–42 percent. Although the three-point difference is within the four percent margin of error, the probability that Clinton is actually leading Sanders is 77 percent.